Spring 2020
Group Project (4)
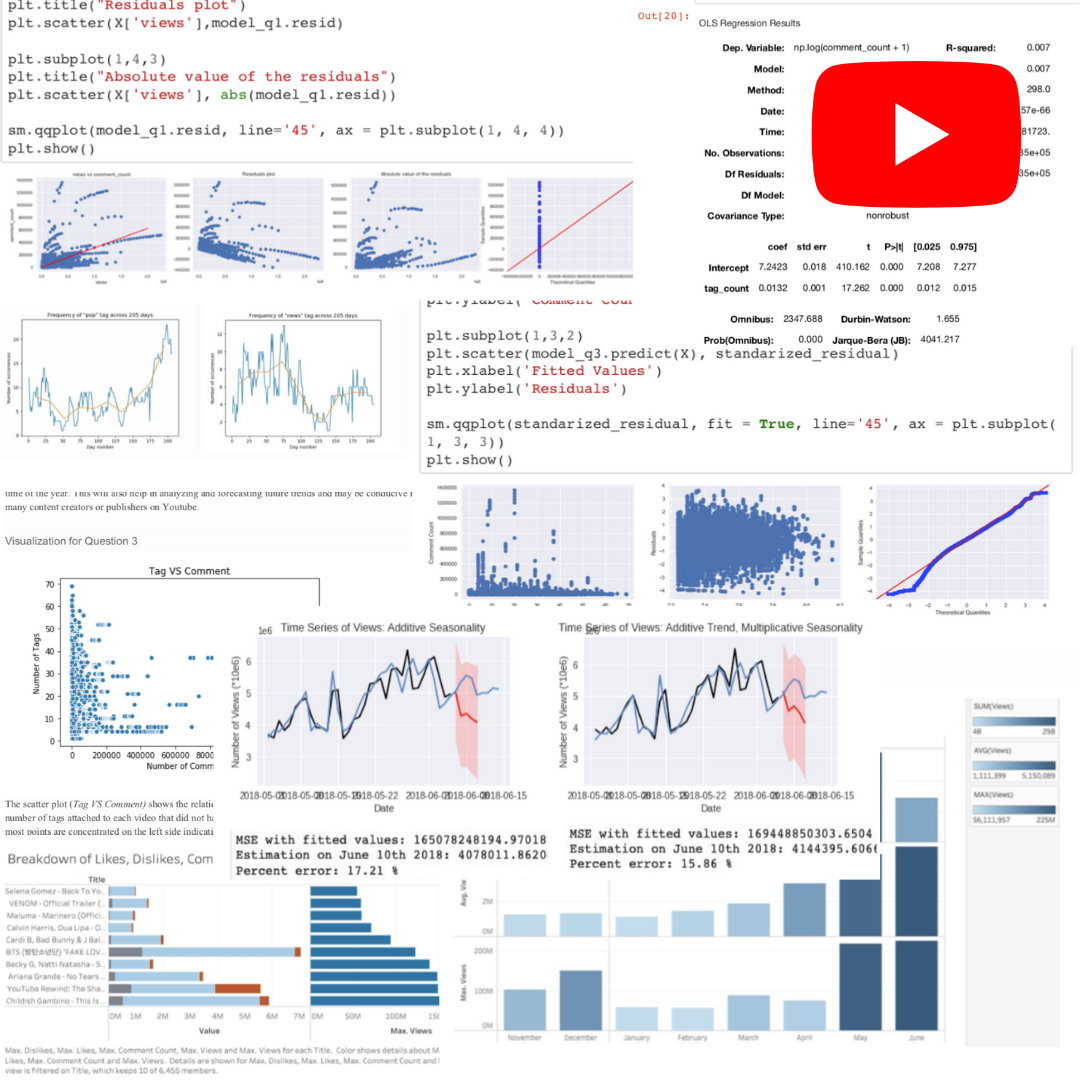
As part of a class project, we seeked to answer 4 research questions on the Youtube dataset to explain certain relationships from the dataset through (1) Data visualizations and (2) Data analysis.
What I did
- Form insightful research questions
- Create most effective data visualization to answer the research question
- Bar/line graphs & Intrepretation
- Data analysis: qq plots, linear regression, logistic regression, time series plot
- Time series plot: forecasting, trend and seasonality modeling
Tools Used:
- Tableau
- Python
- Jupyter Notebook
Visit Data Visualization
Visit Data Analysis